|
Climatic
space detailed methods:
Materials:
- Historic
mean monthly temperature values for July, August and September
(T.historic), taken from 1960-1990 data (1km raster)
- Historic
mean monthly precipitation values for July, August, and September
(P.historic), taken from 1960-1990 data (1km raster)
- Historic
mean temperature values for the hottest (Tmax) and coolest
(Tmin) quarters in 1960-1990 (1km raster)
- Historic
mean precipitation values from the wettest (Pmax) and dryest
(Pmin) quarters in 1960-1990 (1km raster)
- Projected
mean monthly temperature values for July, August, and September
(T.future), taken from models for 2025, 2050, and 2099
(6km raster)
- Projected
mean monthly precipitation values for July, August, and September
(P.future), taken from models for 2025, 2050, and 2099
(6km raster)
- Ecosystem
map (vector)
Given
that the Materials section requires much preparation (raster arithmetic),
the steps for analyzing this type of vulnerability are:
- Calculate
T.range = Tmax - Tmin
- Calculate
P.range = Pmax - Pmin
- Force
the projected 6km data to 1km data (1 grid cell now equals 6*6=36
grid cells with the same value
- Perform
a Gower Metric (GM) to give different weights to future years
(due to a loss of certainty further in the future)
- GM
= 4*(2025 projection) + 2*(2050 projection) + 1*(2099 projection)
- The
Gower Metric gives T.future and P.future
- Average
the GM for all cells within an ecosystem (see diagram)

- For
each ecosystem, calculate (T.historic - T.future) / T.range
- Rank
each ecosystem: the largest absolute values indicate the biggest
projected change from historic climatic space, so they receive
the highest rankings (scale of 1-10)
- For
each ecosystem calculate (P.historic - P.future) / P.range
- Rank
each ecosystem on a similar scale of 1-10
- Add
the temperature and precipitation ranks to obtain vulnerability
in terms of climatic space
Projected
differences in temperature and precipitation
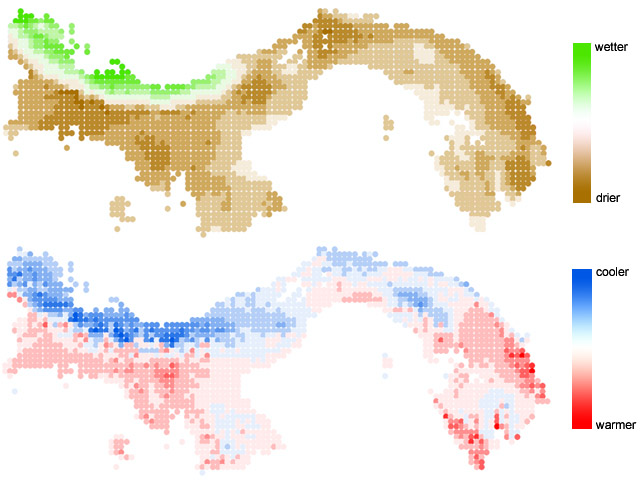
More intense
colors indicate areas that are projected to experience further deviations
from the historic climatic values. While this study did not distinguish
between positive or negative changes, it would be an interesting
continuation.
Data
sources: UNESCO ecosystem map, WORLDCLIM Historical Climate Data,
CATHALAC Climate Change Models (2025, 2050, 2099 projections)
|