| »Themes |
| »Context |
| »Methods |
| »Results |
| »Applications |
| Geostatistics |
| »Conclusions |
| »Downloads |
| »Interact! |
| »Contact |
|
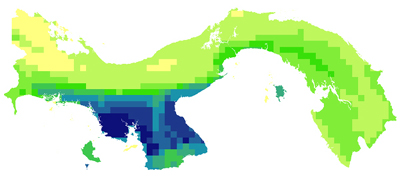
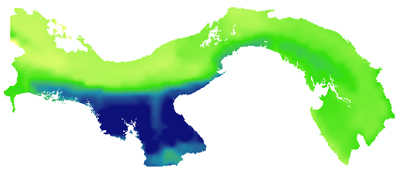
Applied Geostatistics Many earth sciences apply geostatistics to better understand study sites because exhaustive data sets are rarely available. In this case we seek to map EVCC4 - the vulnerability in terms of species sensitivity at a 1km resolution, rather than on a ecosystem-by-ecosystem level. Since this is a preliminary exercise in interpolating spatial data, only amphibian habitat range data is included. We sample the habitat range data on a 10km resolution and intend to use spatial statistics to force the data to the 1km resolution. Kriging and variography are the main analyses used (1). ArcGIS was the first choice in Kriging, but the Geostatistical Wizard does not allow for sufficient manipulation of parameters. It produces a visually-appealing map, but the statistical methods are not transparent (see pictures below).
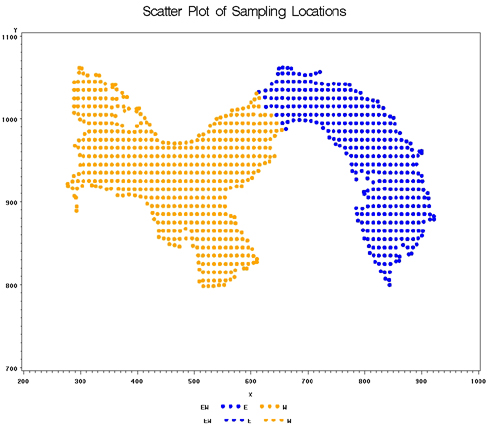
Hence, SAS (Statistical Analysis System) software is used to manually program the processes of variography. Because different trends exist west of the canal than east of the canal, the best trials involved dividing the country into two separate analyses. Most islands were also not included because they are often extreme outliers in terms of habitat ranges (sampling locations shown below).
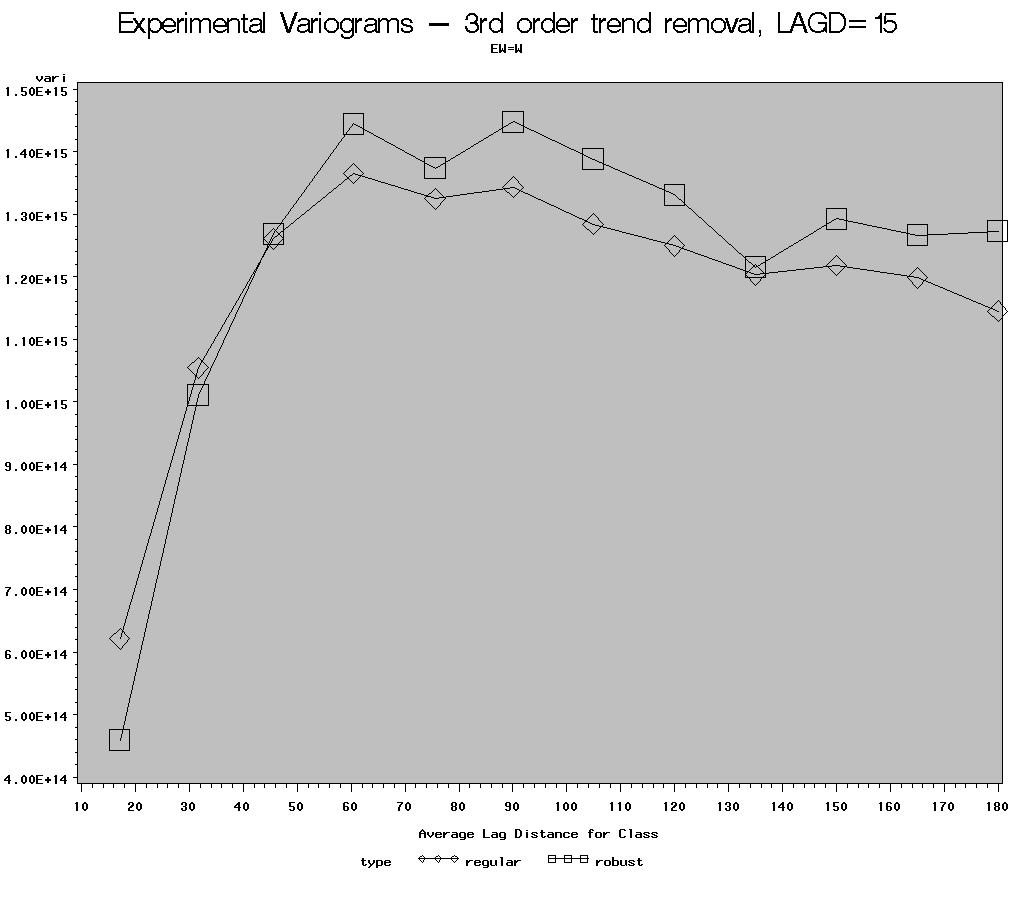
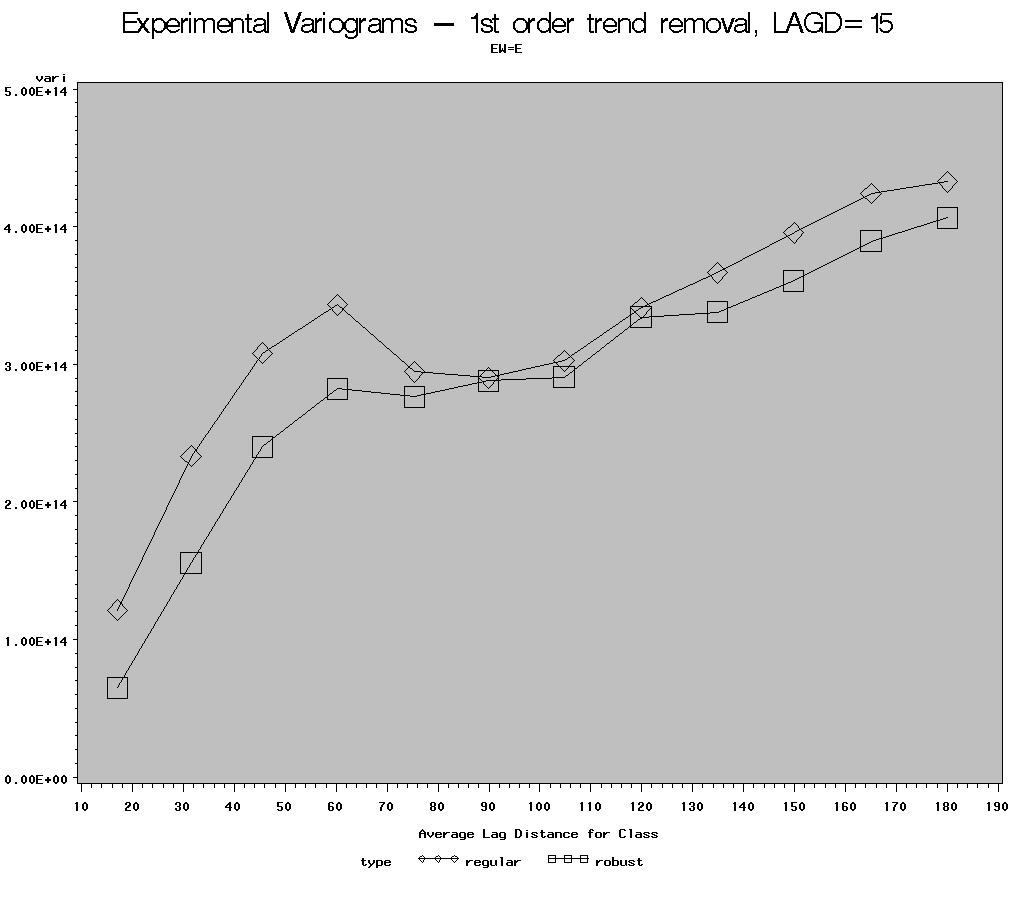
The following are variograms that used a lag distance of 15km. A 3rd order trend removal was used for the western side, and a 1st order trend removal was used for the eastern side.
These curves well represent the shape for a spherical variogram. In light of these results, we can confidently predict the habitat ranges of amphibians at the 1km scale. With this experience in spatial statistics, it will be more feasible to spatially interpolate the vulnerability across the country of Panama--not in terms of ecosystem patch but in terms of geospatial location. Kriging would be particularly useful for the climate change models, which are currently at a 6km resolution. If Kriged accurately, 1km resolution maps of temperature and precipitation projections would be allow for a better analysis of EVCC3.
(1) References
|
|
Geostatistics
|