|
Detailed
species sensitivity methods:
Materials:
- ecosystem
map (vector)
- Species
habitat range data (mammals, birds, and amphibians) (vector)
Steps
(include retrieving data):
- Browse
the InfoNatura database for all mammals that inhabit Panama,
and select these files for download
- Combine
all of the ~243 individual mammal-species files into one mammal
file with ~243 polygons
- Calculate
geometry (area) for these habitat ranges
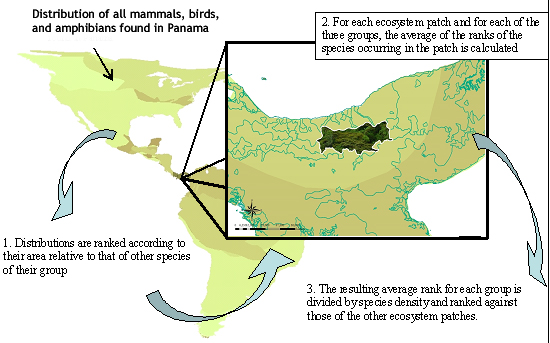
- Rank
these habitat ranges on a scale of 1-5, 5 being the smallest
range and 1 being the largest range (=range_rank)
- This
allows for an equal playing ground for mammal, bird, and amphibian
habitat ranges. Otherwise, gigantic bird habitat ranges would
make miniscule amphibian ranges negligible.
- Spatial
Join the habitat range data
with the ecosystem map to result in a new Arc file with one entry
for every species that lives in every ecosystem (possibility of
~243*1303 > 300,000 items)
- This
is a good point to divide the range_rank data into smaller
groups, because a Spatial Join is a very labor-intensive process
for the computer. For example, we divided the bird range_rank
file into 10 separate Arc files and performed the Spatial
Join
- If
you do this, you must Merge the species together before
the Dissolve
- Dissolve
the ecosystems back into one entry per ecosystem, maintaining
a statistic for the mean habitat range_rank (now back to
a file of 1303 entries and an average habitat range_rank)
- Repeat
for birds and amphibians
- Add
the mammal, bird, and amphibian range_ranks together, and re-scale
to a rank of 1-5.
- Remember,
a rank of 1 means that there is lower vulnerability. According
to our project, an ecosystem with a low vulnerability is one
that is home to a high average habitat range. The most vulnerable
ecosystems host species with the smallest habitat ranges.
Species
sensitivity habitat ranges:
Data
sources: UNESCO ecosystem map, NatureServe InfoNatura species habitat
range maps
|