|
We
chose to measure EVCC in terms of four domains:
- Sea
level rise considers the amount of land 0-1 meter in elevation
in each ecosystem.
- Ecosystem
geometry attempts to quantify the possible negative "edge
effects" an ecosystem might experience. The more edges it
has, the more vulnerable it is to stochastic perturbations from
the outside.
- Climatic
space is a comparison of historic temperature and precipitation
values to projected changes through 2099.
- Species
sensitivity measures the average habitat range for each mammal,
bird, and amphibian, inhabiting an ecosystem.
We
assigned an EVCC value to every "ecosystem patch" in Panamá:
- an
"ecosystem patch" is a single area of a certain ecosystem
type
- there
are 1303 of these patches in Panama
- an
"ecosystem type" is defined more or less by the vegetation
and can be in many places
- there
are 37 ecosystem types in Panama
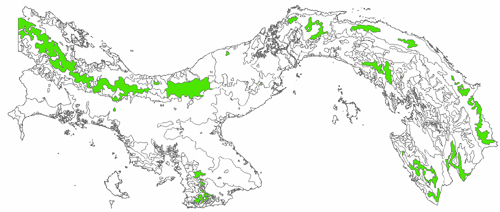
Example:
the tropical broadleaf evergreen submontane rainforest (500-1000m
Caribbean, 700-1200m Pacific) - no human intervention ecosystem
type is located in 27 places in Panama. That is to say, this
one ecosystem type is represented by twenty-seven
ecosystem patches (see picture below--the highlighted areas
are all of the patches that conform to one type)
Listed
here are the summarized methods. The detailed
methods are also available, which include more specific methodology
using ArcGIS.
Click
on a specific step to see an illustration.
- Sea
level rise
- Locate
all areas within 1km of coastline that are 0-1 meter in elevation.
This is called "red zone." [illustration]
- Calculate
the "red zone" density for each ecosystem.
- most
vulnerable = highest red zone density
- Ecosystem
geometry ("edge effects")
- Calculate
the edge-area to core-area ratio of each ecosystem [illustration]
- Determine
irregularity of the geometry by comparing its shape to a perfect
circle of equal area. [illustration]
- Combine
the perimeter to area ratio and the irregularity to create
rank of vulnerability to edge effects.
- most
vulnerable = highest edge to core ratio + highest irregularity
- Climatic
space
- Use
historical data to create a "climatic space" of
temperature and precipitation that each ecosystem is used
to.
- Obtain
climate change "business as usual" scenario data
for temperature and precipitation, and compare this to the
climatic space.
- Rank
the ecosystems based on how far they are expected to deviate
from their climatic space. [illustration]
- most
vulnerable = farthest projected movement out of climatic
space
- Species
sensitivity
- Determine
the habitat ranges for all mammals, birds, and amphibians
that live in Panamá.
- Regardless
of the species richness, rank each ecosystem based on the
average habitat range of species living in that particular
ecosystem. [illustration]
- most
vulnerable = smallest average habitat range
|