| »Themes |
| »Context |
| »Methods |
| »Results |
| Applications |
| »Geostatistics |
| »Conclusions |
| »Downloads |
| »Interact! |
| »Contact |
|
Applications Here we compare the EVCC index to indicators of development and conservation. Human Intervention This table shows the average EVCC values for each degree of human intervention. We are curious to know if systems with more human activity are more vulnerable. EVCC1=sea level rise, EVCC2=ecosystem geometry, EVCC3=climatic space, EVCC4=species sensitivity, EVCC=overall ecosystem vulnerability to climate change. We draw attention to highlighted cells, which have the highest average vulnerability.
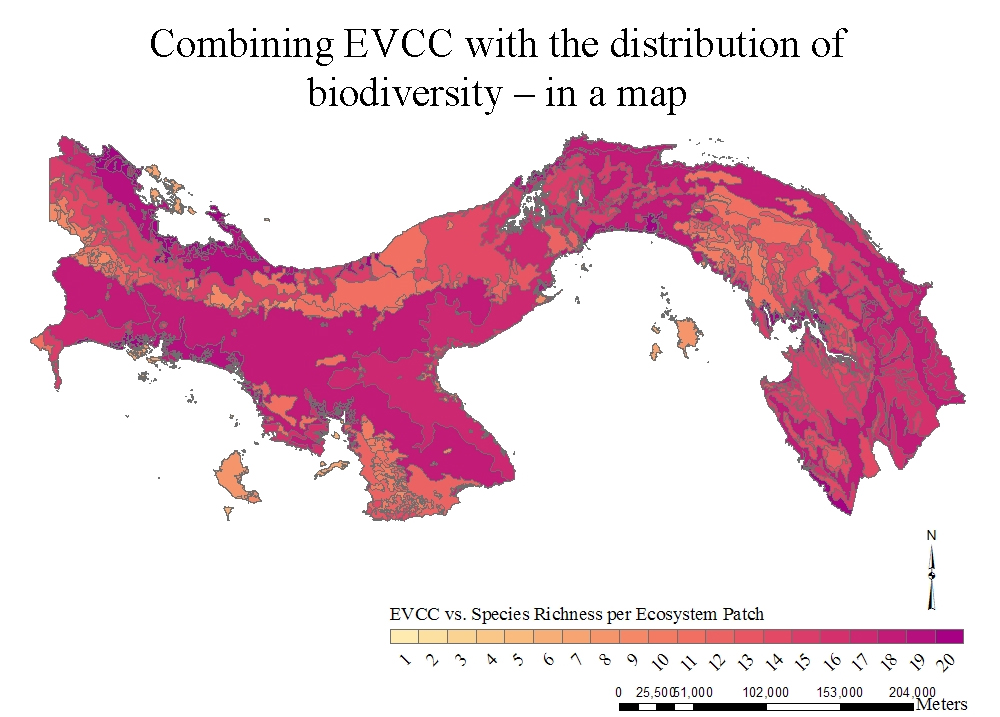
It is reasonable that the highest EVCC1 average exists where there is no human intervention because "small islands" have been assigned a human intervention level of zero, and they are the most vulnerable to sea level rise. Levels 8 and 9--shrimp/salt production and populated places--both include very small-sized ecosystem patches. Again, the EVCC2 values for levels 8 and 9 are probably overstated because "edge effects" are more applicable to natural systems. Productive systems with less than 10% natural vegetation have the highest average overall EVCC value. This is cause for concern because farming relies upon climatic cycles that have been learned and adapted to for centuries. Also, the geographical locations of the patches of this agricultural ecosystem type are such that climate change projections illustrate some of the highest changes in temperature and precipitation. Protected Areas We found that the average EVCC is slightly lower inside protected areas than unprotected areas. This means that the current network of reserve is inadequate to protect the vulnerable areas of Panama in terms of future climate change. This effect is much more pronounced in EVCC1; however one must keep in mind that this analysis did not include protected marine areas because the ecosystem patch map does not include aquatic ecosystems. Species Richness and Endemism First of all, endemism for mammals, birds, and amphibians is inversely related to the species richness in Panama. That is, there are more birds than mammals and more mammals than amphibians in the country. At the same time, there are the many more endemic amphibians than there are endemic birds. Generally, correlations were found for neither species richness nor endemism excepting for EVCC3 where regions of high endemism had low vulnerability values. In order to highlight regions that had both high species richness and overall EVCC, species richness per ecosystem patch was multiplied by overall EVCC. The region that stands out the most in this map is Bocas del Toro. Western Panama, the areas of the Canal, and the south of the Darien are highlighted as well.
Also see the Geostatistics page for spatial statistics of species habitat ranges. One of the biggest challenges in using the EVCC in conservation will be to weigh its relative importance in comparison to other human drivers of biodiversity loss, such as like habitat degradation, over-exploitation and invasive species. Because it estimates an important threat to ecosystems, climate change--usually over-looked in biodiversity assessments--can become a very useful tool for conservation.
|
|
<
Results
|
Applications
|