| »Themes |
| »Context |
| Methods |
| »Results |
| »Applications |
| »Geostatistics |
| »Conclusions |
| »Downloads |
| »Interact! |
| »Contact |
|
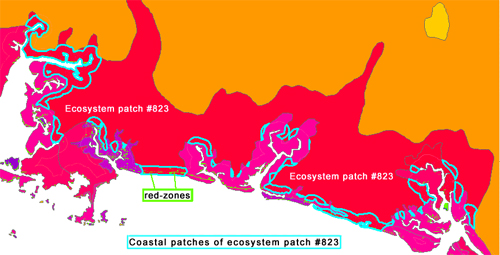
Sea level rise illustration:
The blue outlines represent the coastal areas of "ecosystem patch #823." The tiny green dots are areas of 0-1 meter in elevation. The red zone density was calculated by dividing the area of all red zones in an ecosystem patch by its total area (regardless of coastal area). |