| »Themes |
| »Context |
| Methods Detailed |
| »Results |
| »Applications |
| »Geostatistics |
| »Conclusions |
| »Downloads |
| »Interact! |
| »Contact |
|
Detailed sea level rise methods: Materials:
Steps:
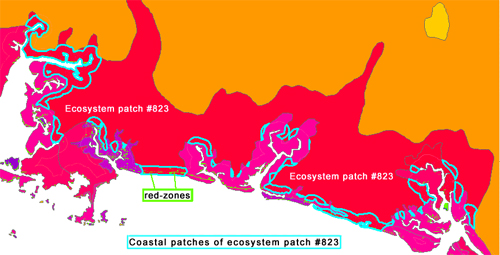
Sea level rise illustration:
The blue outlines represent the coastal areas of "ecosystem patch #823." The tiny green dots are areas of 0-1 meter in elevation. The red zone density was calculated by dividing the area of all red zones in an ecosystem patch by its total area (regardless of coastal area). Data sources: UNESCO ecosystem map, USGS Digital Elevation Model |

|
Detailed
sea level rise methods
|