| »Temas |
| »Contexto |
| »Métodos |
| Resultados |
| »Aplicaciones (inglés) |
| »Geoestadísticas (inglés) |
| »Conclusiones |
| »Downloads |
| »Interact! |
| »Contáctenos |
|
Resultados & Discusiones Un valor de la vulnerabilidad existe para cada ecosistema de Panamá. Aquí, discutimos las tendencias (por el mejor parte en inglés). Los nombres de los ecosistemas importantes son españoles. Para resultados completos, visita la pagina Downloads. Mietras determinamos un valor de EVCC para cada parcela de los ecosistemas, muchas de las descripciones vine de esta tabla de valores resumidos para las 37 clases de los ecosistemas.
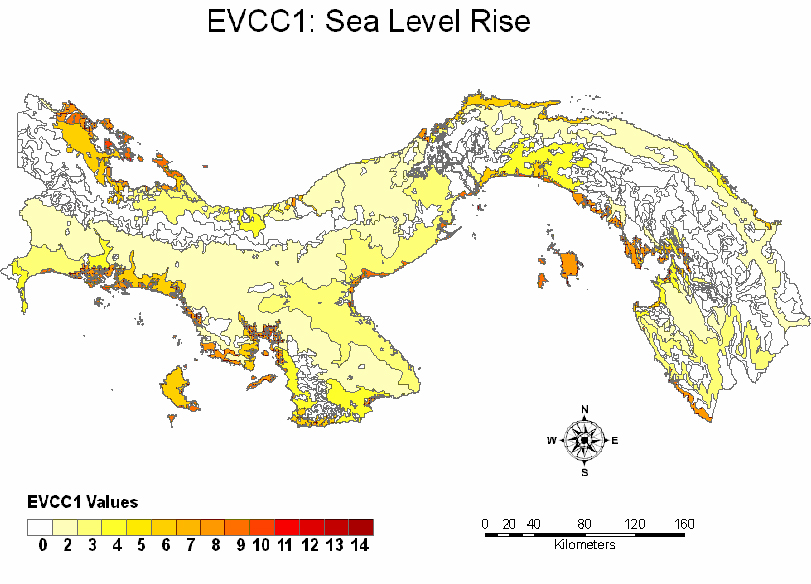
The most vulnerable ecosystem patches are of the following type:
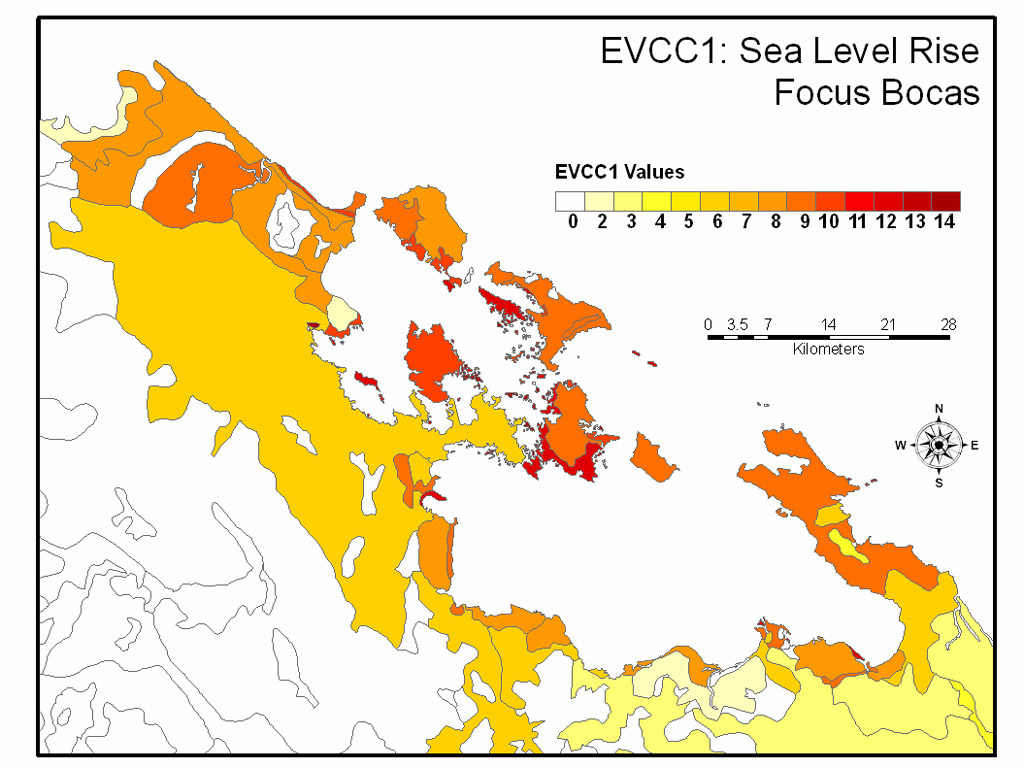
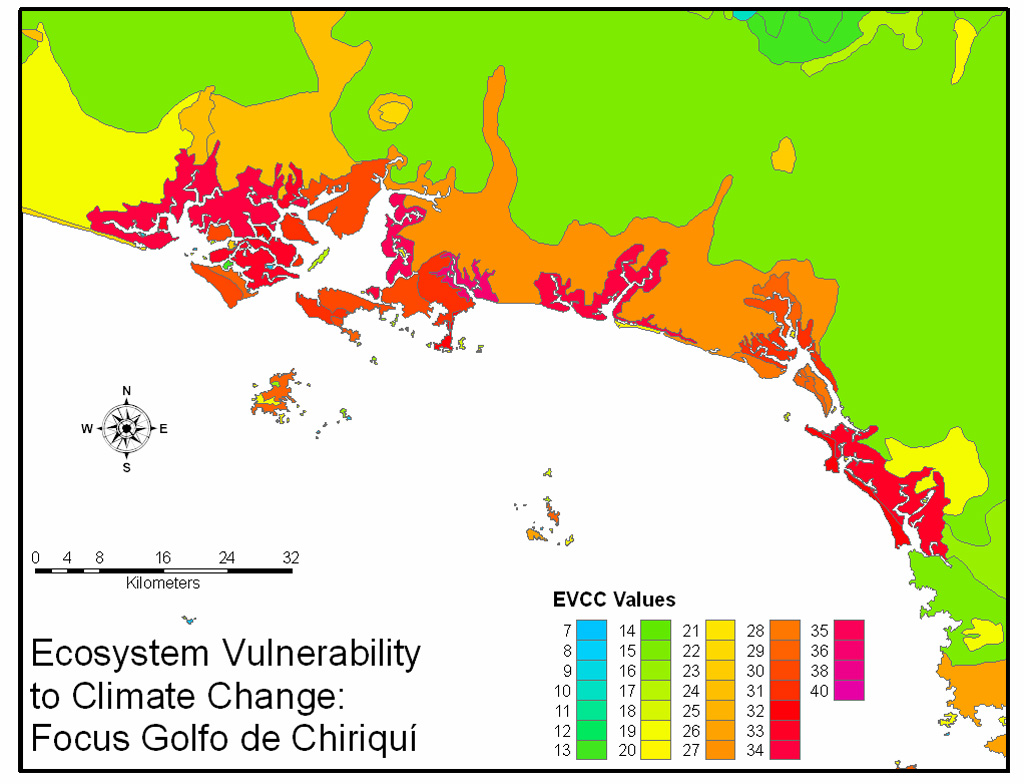
Of the 62 patches that have the highest EVCC1 value, 54 of them are small islands. Over half of these small islands are in the Bocas del Toro province. Bocas is also the location of the only populated place patch with the highest possible EVCC1 value. An almost identical mix of ecosystem types with patches of high vulnerability exists along the Gulf of Chiriquí. In terms of average EVCC1 the two most vulnerable ecosystem types are
They also account for an extremely small percentage of total land in Panama. This could be a cause for concern because of the rarity of this ecosystem type.
Selecting land of only 0-1m in elevation involved using a DEM on the 90m scale. There are some problems:
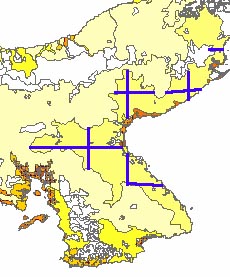
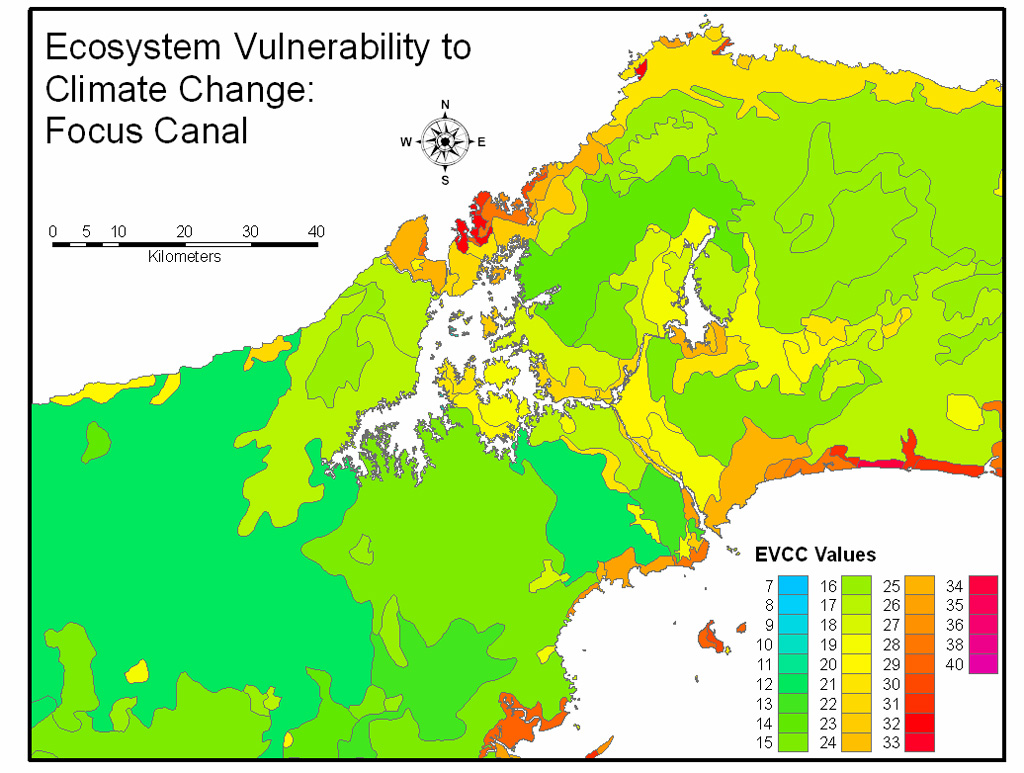
Still, the process identified the many of those tiny patches that would be more affected by this kind of discrepancy and often labeled them as highly vulnerable. The map of EVCC1 well-illustrates the particular coastal regions that are more vulnerable than inland areas. By applying a color scheme to a whole ecosystem patch and not simply those coasts that are susceptible to flooding, there is the possibility of misconception. Most noticeable is the second largest ecosystem patch (Productive system with less than 10% natural or spontaneous vegetation) that covers a large portion of the Azuero Peninsula. Because many of its boundaries are coasts, there is a high chance that parts of it will be susceptible to sea level rise. This shows up in the fact that it was given an EVCC1 value of 3. Had this patch been divided into smaller sub-patches, a definite difference in perception would occur. See below for a possible way to avoid this problem. The blue lines could separate this overly-large ecosystem patch.
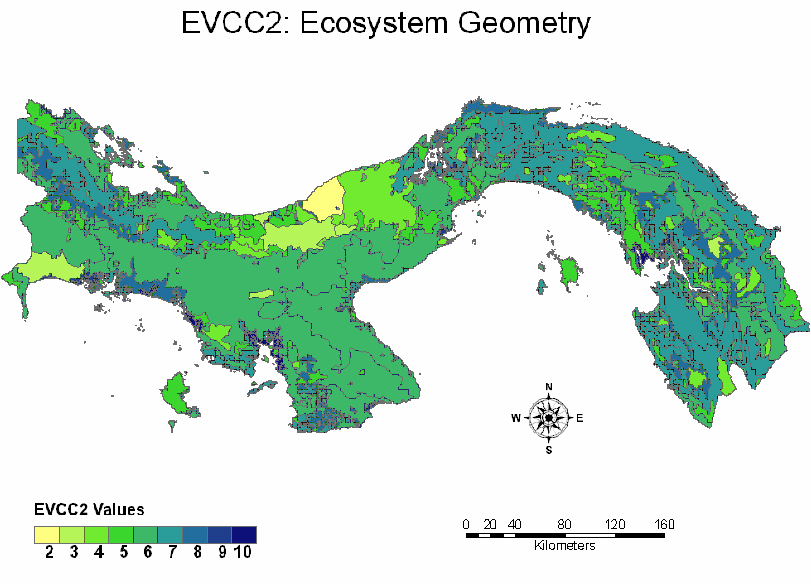
Many of the coastal ecosystem patches are again highly vulnerable. This means that they are the most irregularly shaped (probably long and thin in this case) and they are relatively small (having a large edge to core ratio). These ecosystems types are
There is a very high variance among many ecosystem types, particularly agricultural systems. Some of these patches are very vulnerable, while others are not. This analysis is a direct reflection of how ecosystems have been delineated. It stands to reason that many ecosystem patches along coasts have been highlighted as more vulnerable because vegetation changes very dramatically from coast to inland. These dramatic changes are represented by smaller, narrower ecosystem patch-sizes, which cause large edge to core ratios and higher irregularity. The geometry analysis meant to capture those ecosystem patches with the most susceptibility to negative edge effects. Even though an agricultural system could have an irregular shape, the theory behind its vulnerability does not stand. That is to say, this geometrical analysis is much more pertinent for natural systems, because human-altered systems are often very buffered from surrounding environmental changes.
General trends of the map suggest that regions with the most vulnerable ecosystem patches are found in the:
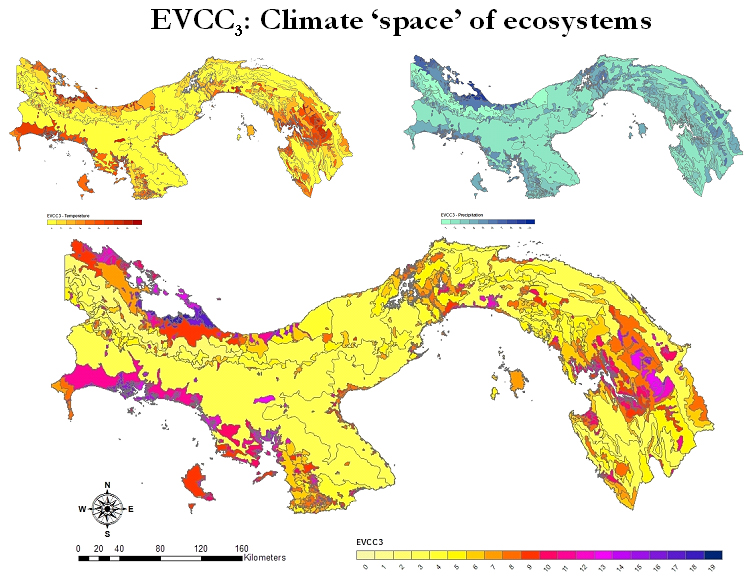
Isla Coiba has intermediate vulnerability, but its status as an island makes the micro-climate less predictable. Similar uncertainties exist for other islands. In general, bigger ecosystem patches are less vulnerable, making an important proportion of the country's area low in vulnerability. Vulnerability in terms of temperature changes often ranks higher, except for mountain ecosystems where precipitation is projected to deviate further. The most vulnerable ecosystem types are:
Only 770 out of 1303 patches were evaluated here due to the resolution of the climatic data. Consequently, many small islands were not included in this part of the analysis. The combined area of these ecosystem patches is only 0.16%, so this exclusion is not significant in terms of the amount of space evaluated. In general, the interior of the country receives low vulnerability ranks, including the Peninsula de Azuero but excluding some ecosystem patches in the Darien and around the Canal that are ranked with intermediate-high vulnerability. Given that a great proportion of these systems are highly exploited for agriculture, this is a positive result in economic terms. The trends gathered from EVCC3 show that the vulnerability to climate change in terms of the climatic "space" of ecosystems is asymmetrically distributed across the country and that it is wrong to assume all ecosystems will react similarly.
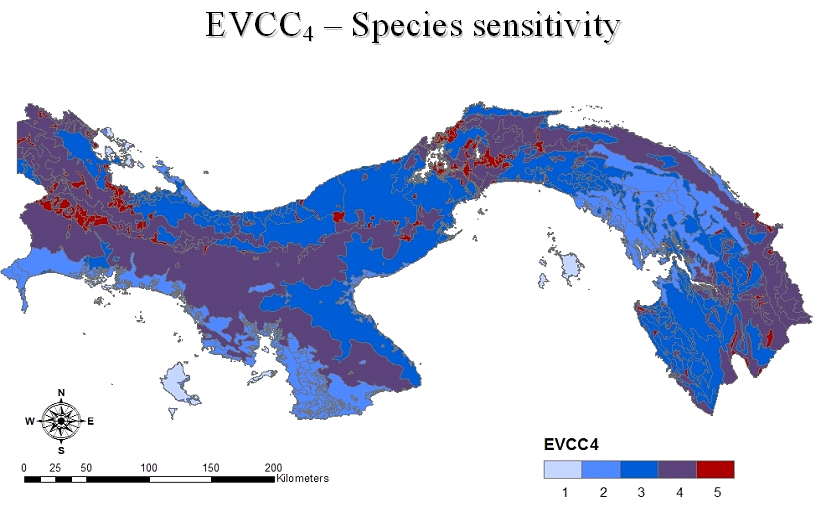
Mountains ecosystems and the northwestern part of the country appear more vulnerable. Small islands generally got lower scores.
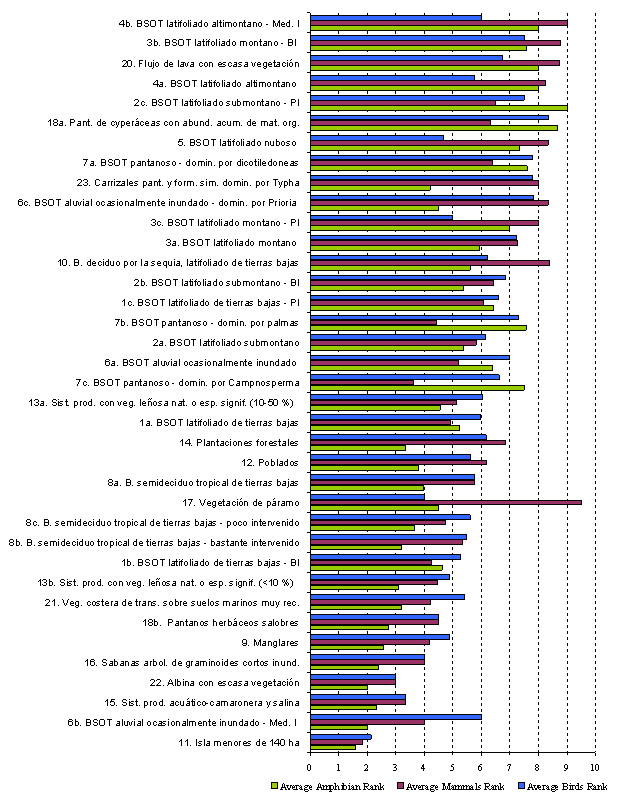
The mountains' high vulnerability rankings might be partly biased from the fact that the biggest ecosystem patch was very species-rich and that accounting for species density did not completely eliminate the area effect. The result of small islands' lower vulnerabilities is probably due to their low species density compared to the mainland. It would be worthwhile to look more closely at endemic species in islands as these are likely to be sensitive to climate change. Regression analysis between mammals, birds, amphibians, and overall species sensitivity, would be appropriate in order to determine the strength of the relationships between each variable.
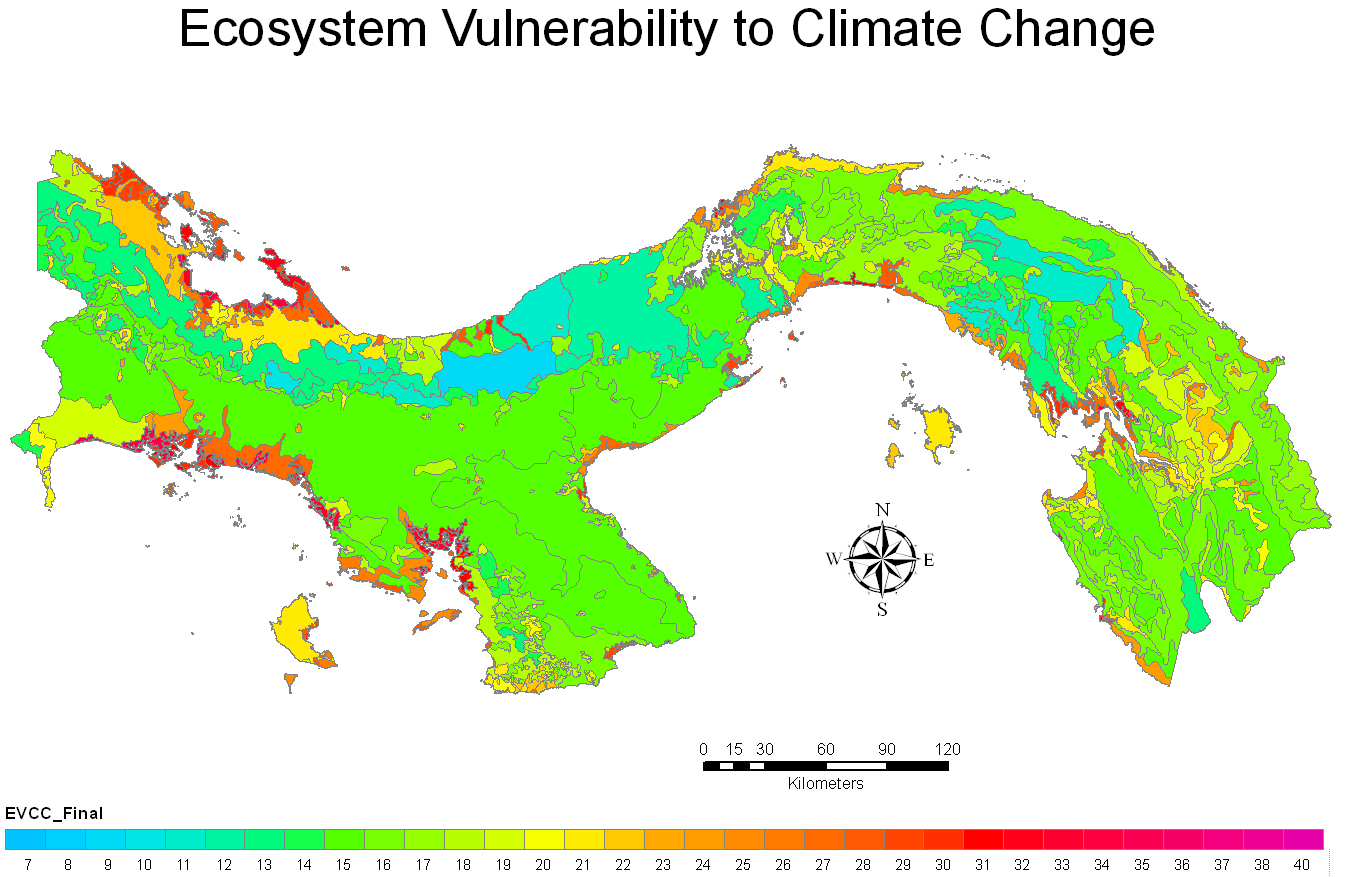
All of the thirty most vulnerable ecosystem patches (overall EVCC of 34 to 40) are found in and are:
An important general observation is that the ecosystems types with the highest average scores are:
The degree variance did not seem to matter so much on the number of patches an ecosystem type had. For example, an ecosystem type with only seven or eight patches had just as high a variance as one with hundreds of patches.
Even though we provide justification in deciding how to weigh each of the individual EVCC values, the overall EVCC equation was still formulated somewhat arbitrarily. It should be emphasized that the vulnerability index illustrates relative vulnerability, rather than absolute values. Had the small islands been given an EVCC3 value, the overall representation of vulnerability for these very small ecosystems would probably be more accurate. A possible solution to determine a vulnerability value in terms of climate space could be to assign the same value as the ecosystem patch closest to that "overlooked" patch. The map is valuable but only to a certain extent. It must be reiterated that this study did not aim to map vulnerability but rather assess vulnerability of each ecosystem patch in the country. The map is a visual representation that aids understanding of the results. Still, one can gain a general sense of the geographic areas of higher vulnerability. The most valuable information comes from comparing individual ecosystem patches. |
|||||||||||||||||
|
<
Métodos
|
Resultados
|